This PowerBI report provides key insights into your Contact Center’s performance, covering Calls, Queues, and Agents. The reports allow you to track various metrics, understand call handling efficiency, and monitor agent productivity.
To understand the data it is important to see in what perspective the data is created. In this database we have multiple perspectives
Caller perspective (also known as the customer or external)
Queue perspective (internal company)
Agent perspective (internal employee of the company)
We try to explain the difference between the perspectives with an example of a case, and what the perspective of the different parties are.
A customer calls in and after 5 minutes and 10 seconds the call is picked up by an agent. The callflow the customers follows the following path
Incoming call is first being offered to queue 1 with 3 agents configured in the queue
Queue 1 has a timeout of 5 minutes. The call is then offered to an overflow queue with 20 agents.
For the customer the time to pick up is 5 minutes and 10 seconds, so for the customer this is the wait time and is annoyed that it takes long to talk to an agent.
The agent in queue 2 picks up in 10 second and has a good feeling as he answers very fast.
The agents in queue 1 also have a good feeling, because they were all occupied in a call with another customer.
So with this callflow you see that there is no simple solution for the question, what is the wait time, because it depends on who you ask the question. In our database we tried to have these perspectives available, so you have the insights to see the issue from multiple angles.
How to navigate
Navigation Menu: Use the top navigation menu to access different report sections.
Slicers & Filters: Apply slicers to filter data by specific time periods, call types, or other criteria for detailed analysis.
Interactivity: Click on any graph element (such as bars or lines) to drill down into the data for more detailed insights.
How to configure
After receving an access to Reporting page at ROGER365 admin portal, download .zip package which contains everything needed to start using this PowerBI Reporting module.
Dashboard
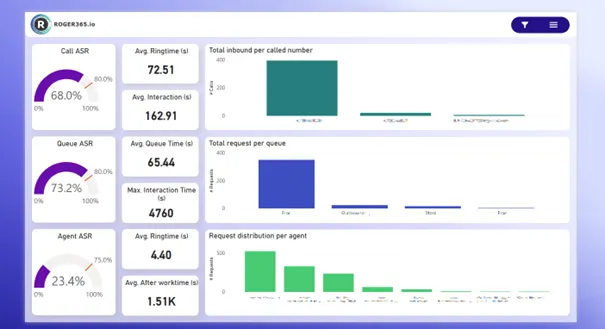
This page offers a comprehensive overview of key performance indicators (KPIs) for the Contact Center. You can view metrics such as total calls, answer rates, average interaction time, and average ring time, helping to monitor the overall performance of the Contact Center.
The page is divided into three horizontal sections based on Call, Queue and Agent perspective.
Metric
Description
Call ASR
Percentage of inbound calls that were successfully connected to an agent, relative to the total number of attempted inbound calls. A higher ASR indicates that most calls are being answered properly, reflecting a well-functioning Contact Center.
Average Ringtime (s)
The average amount of time in seconds that a call rings before being answered by the system.
Average Interaction (s)
The average amount of time in seconds that a caller spend interaction with the Contact Center.
Total inbound per called number
The total number of received inbound calls per specific phonenumber or Resource Account.
Queue ASR
Percentage of Queue requests that were successfully connected to an agent, relative to the total number of attempted queue requests. A higher ASR indicates that most queue requests are being answered properly, reflecting a well-functioning Contact Center.
Average Queue Time (s)
The average amount of time in seconds that a caller spends waiting in the queue before speaking to an agent.
Max Interaction Time (s)
The maximum amount of time in seconds that a caller spend interaction with the Contact Center.
Total request per queue
The total number of queue requests per specific queuename.
Agent ASR
Percentage of inbound calls that were successfully connected to an agent, relative to the total number of attempted inbound calls. A higher ASR indicates that most calls are being answered properly, reflecting a well-functioning Contact Center.
Average Ringtime (s)
The average amount of time in seconds that a call rings at an agent before being answered.
Average after worktime (s)
The average amount of time in seconds agents spend after completing an interaction to wrap up or complete post-call tasks.
Request distribution per agent
The total number of queue requests that are assigned to a specific agent.
Calls Summary
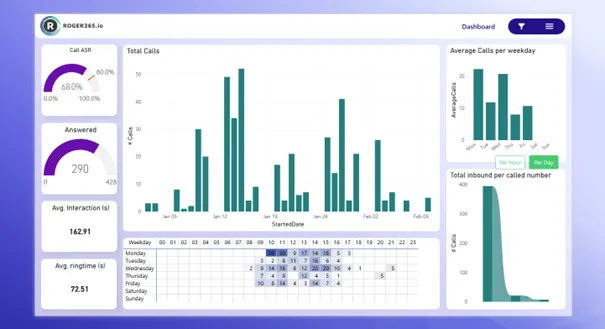
This page provides an overview of all call-related metrics, including answered calls, average interaction times, and the overall call answer-seizure ratio (ASR). It offers insights into the total number of calls handled, as well as detailed breakdowns of call volumes over specific time periods. This page is essential for tracking call center performance and identifying trends in call handling efficiency.
Metric
Description
Call ASR
Percentage of inbound calls that were successfully connected to an agent, relative to the total number of attempted inbound calls. A higher ASR indicates that most calls are being answered properly, reflecting a well-functioning Contact Center.
Answered
Amount of inbound calls that were successfully connected to an agent, relative to the total number of attempted inbound calls.
Average Interaction (s)
The average amount of time in seconds that a call rings before being answered by the agent.
Average Ring time (s)
The average amount of time in seconds that a caller spend interaction with the Contact Center.
Total Calls
The total number of inbound calls received.
Heatmap
Call volumes across different times of day and days of the week. The color intensity shows when calls are highest (darker colors) and lowest (lighter colors).
Average calls per weekday
Average number of inbound calls received on each day of the week, helping to identify peak call days for staffing optimization.
Total inbound per called number
The total number of received inbound calls per specific phone number or resource account.
Calls Volume Analysis
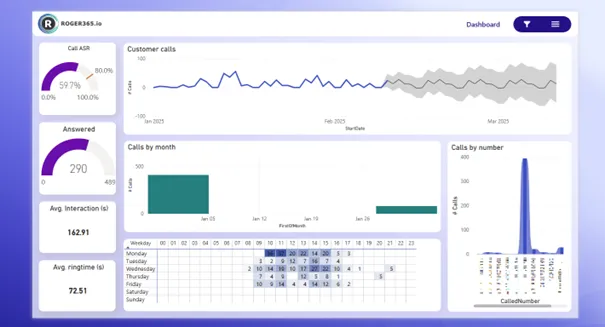
This page analyzes call volume patterns by different timeframes. It provides insights into call distribution across weekdays, as well as detailed breakdowns of calls by specific numbers, offering an understanding of peak call times and trends.
Metric
Description
Call ASR
Percentage of inbound calls that were successfully connected to an agent, relative to the total number of attempted inbound calls. A higher ASR indicates that most calls are being answered properly, reflecting a well-functioning Contact Center.
Answered
Amount of inbound calls that were successfully connected to an agent, relative to the total number of attempted inbound calls.
Average Interaction (s)
The average amount of time in seconds that a call rings before being answered by the system.
Average Ring time (s)
The average amount of time in seconds that a caller spend interaction with the Contact Center.
Customer calls
The total number of inbound calls made by customers. This provides an overview of the volume of interactions from customers.
Calls by month
Breakdown of total calls received per month.
Heatmap
Call volumes across different times of day and days of the week. The color intensity shows when calls are highest (darker colors) and lowest (lighter colors).
Total inbound per called number
The total number of received inbound calls per specific phone number or resource account.
Queue Summary
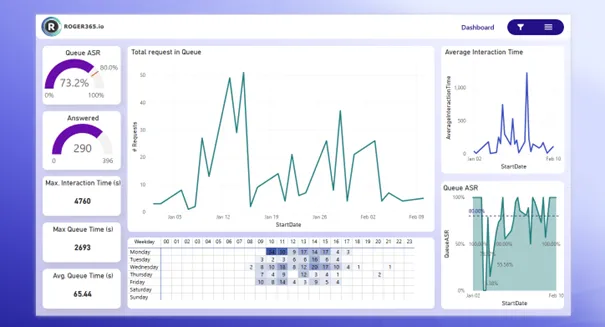
This page gives a summary of queue performance, displaying metrics such as total requests in the queues, average interaction time, and queue statistics for each weekday. It provides an in-depth view of how well different queues are performing over time.
Metric
Description
Queue ASR
Percentage of Queue requests that were successfully connected to an agent, relative to the total number of attempted queue requests. A higher ASR indicates that most queue requests are being answered properly, reflecting a well-functioning Contact Center.
Answered
Amount of Queue requests that were successfully connected to an agent, relative to the total number of attempted queue requests.
Maximum Interaction time (s)
The maximum amount of time in seconds that a caller spends interaction with the Contact Center.
Maximum Queue time (s)
The maximum amount of time in seconds that a caller spends waiting in the queue before speaking to an agent.
Average Queue time (s)
The average amount of time in seconds that a caller spends waiting in the queue before speaking to an agent.
Total request in Queue
The total number of requests.
Heatmap
Call volumes across different times of day and days of the week. The color intensity shows when calls are highest (darker colors) and lowest (lighter colors).
Average Interaction time
The average amount of time that a caller spend interaction with the Contact Center in seconds.
Queue ASR
Percentage of Queue requests that were successfully connected to an agent, relative to the total number of attempted queue requests. A higher ASR indicates that most queue requests are being answered properly, reflecting a well-functioning Contact Center.
Queue Performance
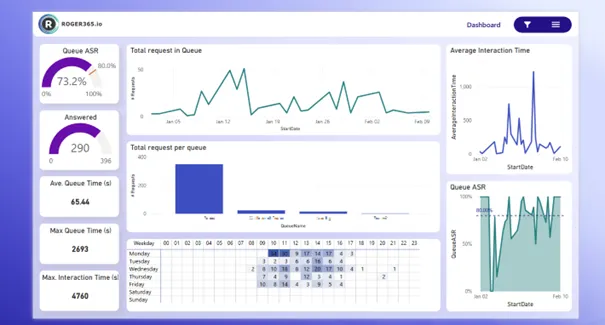
This page focuses on the performance of individual queues. It displays the number of requests per queue, average queue times, and other performance metrics. It is designed to help analyze queue efficiency and identify areas for improvement.
Metric
Description
Queue ASR
Percentage of Queue requests that were successfully connected to an agent, relative to the total number of attempted queue requests. A higher ASR indicates that most queue requests are being answered properly, reflecting a well-functioning Contact Center.
Answered
Amount of Queue requests that were successfully connected to an agent, relative to the total number of attempted queue requests.
Maximum Interaction time (s)
The maximum amount of time in seconds that a caller spends interaction with the Contact Center.
Maximum Queue time (s)
The maximum amount of time in seconds that a caller spends waiting in the queue before speaking to an agent.
Average Queue time (s)
The average amount of time in seconds that a caller spends waiting in the queue before speaking to an agent.
Total request in Queue
The total number of requests.
Total request per Queue
The total number of requests received by a specific queue.
Heatmap
Call volumes across different times of day and days of the week. The color intensity shows when calls are highest (darker colors) and lowest (lighter colors).
Average Interaction time
The average amount of time in seconds that a caller spend interaction with the Contact Center.
Queue ASR
Percentage of Queue requests that were successfully connected to an agent, relative to the total number of attempted queue requests. A higher ASR indicates that most queue requests are being answered properly, reflecting a well-functioning Contact Center.
Agent Summary
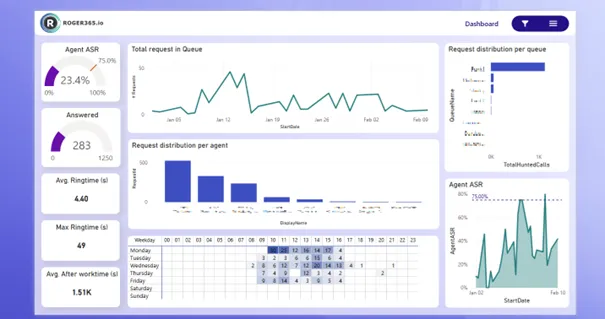
This page offers a breakdown of agent performance metrics, including request distribution per agent, average ring times, and performance in answering calls. It allows for monitoring of overall agent activity and overall team performance.
Metric
Description
Agent ASR
Percentage of inbound calls that were successfully connected to an agent, relative to the total number of attempted inbound calls. A higher ASR indicates that most calls are being answered properly, reflecting a well-functioning Contact Center.
Answered
Amount of inbound calls that were successfully connected to an agent, relative to the total number of attempted inbound calls.
Maximum Interaction time (s)
The maximum amount of time in seconds that a caller spend interaction with the agent.
Average Ring time (s)
The average amount of time in seconds that a call rings at an agent before being answered.
Maximum Ring time (s)
The maximum amount of time in seconds that a call rings at an agent before being answered.
Average After worktime (s)
The average amount of time in seconds agents spend after completing an interaction to wrap up or complete post-call tasks.
Total request in Queue
The total number of requests.
Request distribution per agent
The total number of queue requests that are assigned to a specific agent.
Heatmap
Call volumes across different times of day and days of the week. The color intensity shows when calls are highest (darker colors) and lowest (lighter colors).
Request distribution per queue
The total number of specific queue requests that are assigned to a specific agent.
Agent ASR
Percentage of inbound calls that were successfully connected to an agent, relative to the total number of attempted inbound calls. A higher ASR indicates that most calls are being answered properly, reflecting a well-functioning Contact Center.
Agent Performance
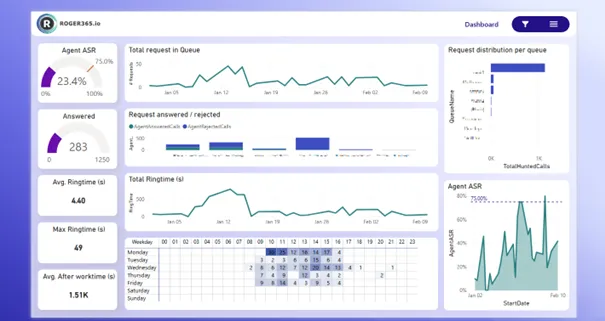
This page focuses on the performance of agents, analyzing key metrics such as answered/rejected calls, total ring time, and agent answer-seizure ratios. It helps track agent efficiency and identify top performers in your Contact Center.
Metric
Description
Agent ASR
Percentage of inbound calls that were successfully connected to an agent, relative to the total number of attempted inbound calls. A higher ASR indicates that most calls are being answered properly, reflecting a well-functioning Contact Center.
Answered
Amount of inbound calls that were successfully connected to an agent, relative to the total number of attempted inbound calls.
Maximum Interaction time (s)
The maximum amount of time in seconds that a caller spends interaction with the agent.
Average Ring time (s)
The average amount of time in seconds that a call rings at an agent before being answered.
Maximum Ring time (s)
The maximum amount of time system in seconds that a call rings at an agent before being answered.
Average After worktime (s)
The average amount of time in seconds agents spend after completing an interaction to wrap up or complete post-call tasks.
Total request in Queue
The total number of requests.
Request answered / rejected
The total number of queue requests that are assigned to a specific agent.
Total Ring time (s)
The amount of time in seconds that a call rings at an agent before being answered.
Heatmap
Call volumes across different times of day and days of the week. The color intensity shows when calls are highest (darker colors) and lowest (lighter colors).
Request distribution per queue
The total number of specific queue requests that are assigned to a specific agent.
Agent ASR
Percentage of inbound calls that were successfully connected to an agent, relative to the total number of attempted inbound calls. A higher ASR indicates that most calls are being answered properly, reflecting a well-functioning Contact Center.
Agent Availability & Utilization
This page provides an overview of agent availability and their utilization, showing how much time agents are spending in different statuses (available, away, busy, etc.). It helps track staffing and identify if there are any gaps in coverage.
Metric
Description
Agent ASR
Percentage of inbound calls that were successfully connected to an agent, relative to the total number of attempted inbound calls. A higher ASR indicates that most calls are being answered properly, reflecting a well-functioning Contact Center.
Answered
Amount of inbound calls that were successfully connected to an agent, relative to the total number of attempted inbound calls.
Maximum Interaction time (s)
The maximum amount of time in seconds that a caller spend interaction with the agent.
Average Ring time (s)
The average amount of time in seconds that a call rings at an agent before being answered.
Maximum Ring time (s)
The maximum amount of time in seconds that a call rings at an agent before being answered.
Average After worktime (s)
The average amount of time in seconds agents spend after completing an interaction to wrap up or complete post-call tasks.
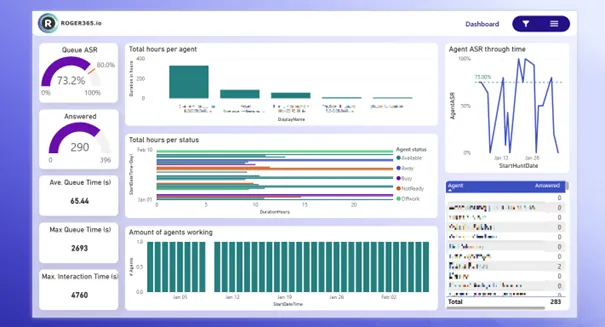
Total hours per agent
Total hours logged by each agent, which can help assess agent workload and availability over a period.
Total hours per status
Tracks the total time agents spend in various statuses to identify potential gaps in coverage.
Amount of agents working
Number of agents actively working during a specific time period. This is useful for tracking resource allocation and availability.
Agent ASR through time
Measures how ASR changes over time, allowing the identification of trends or improvements in call handling efficiency.
Amount of answered calls per agent
The number of calls successfully answered by each agent. This helps identify the performance of individual agents.
Agent Actions
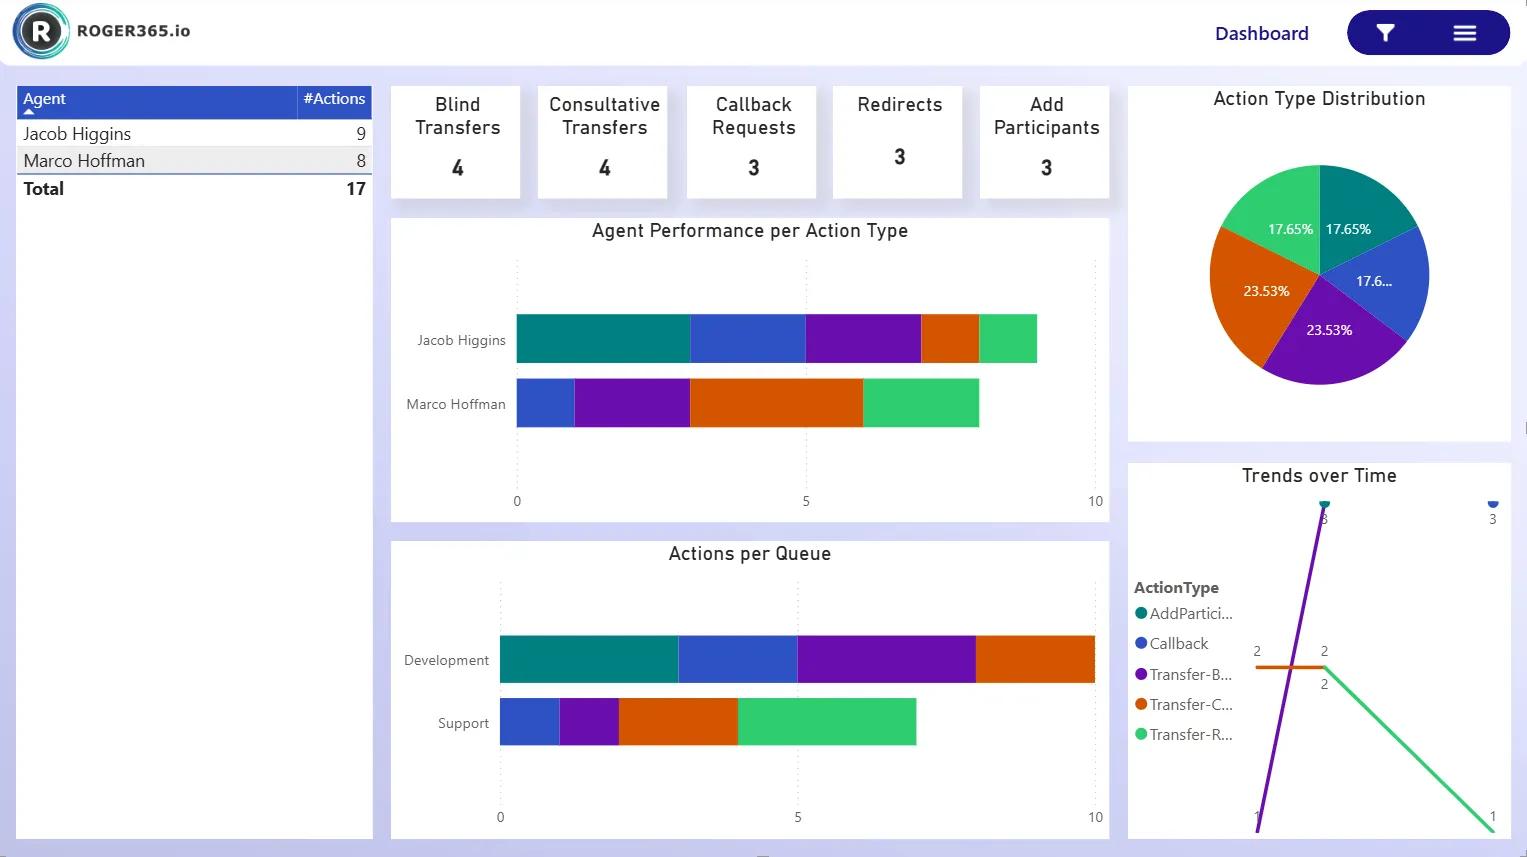
This page provides an overview of key agent actions during Contact Center calls, including Blind and Consultative Transfers, Callback Requests, Redirects, and Add Participants. It shows how frequently each action is used by agent and queue, highlights trends over time, and offers a clear view of agent activity and performance.
Metric
Description
Agent Performance per Action Type
Shows the volume of actions performed by each agent, broken down by action type. It helps identify how active each agent is and which actions they perform most.
Actions per Queue
Shows the volume of performed agent actions per Queue. Highlights the workload per queue and how agent actions are distributed.
Action Type Distribution
A pie chart displaying the distribution of actions performed by agents. Shows the overall proportion of different actions performed by agents.
Trends over Time
Line chart showing trends in agent actions over set period of time. Reveals patterns and changes in agent activity over time.
WFM
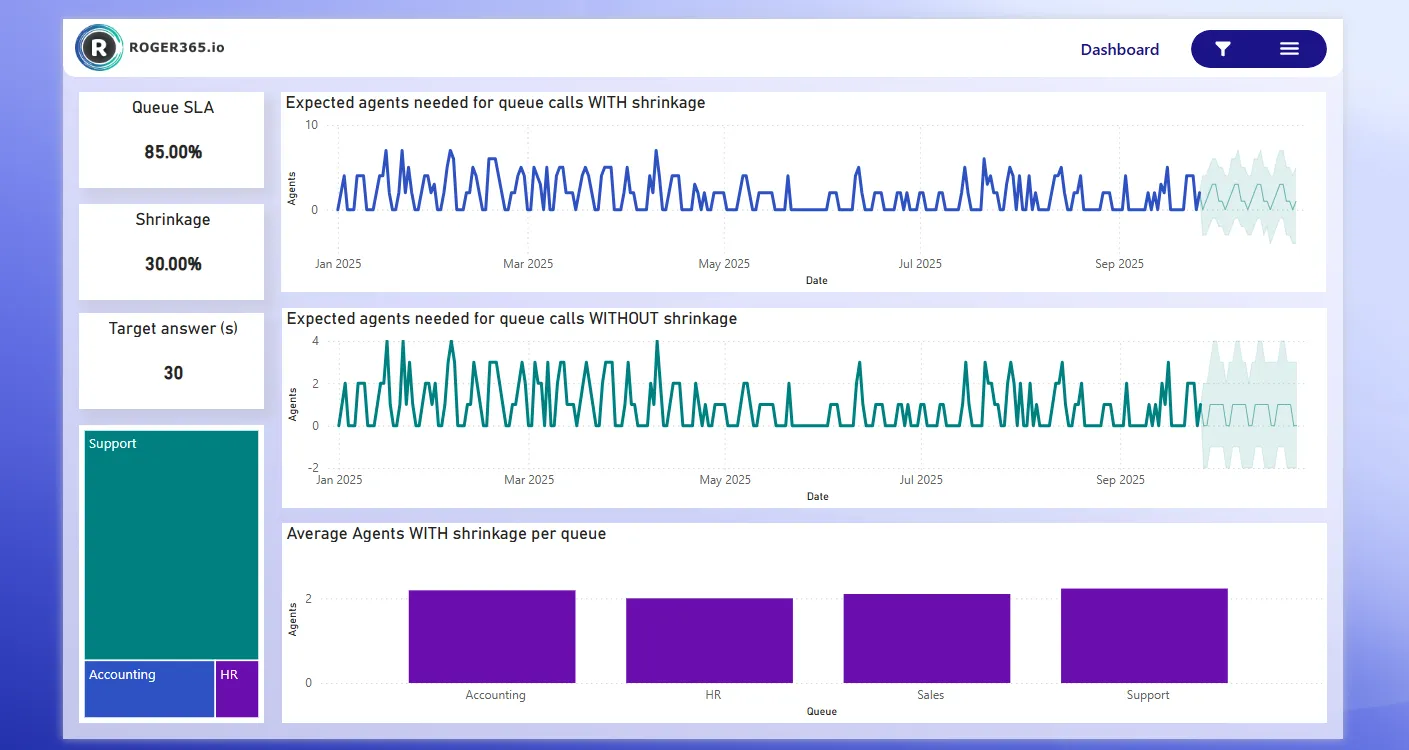
This page provides an overview of key Workforce Management (WFM) metrics for the agents within Contact Center queues. Using the Erlang C formula, the dashboard estimates the number of agents needed to handle calls, includes adjustments for shrinkage, and measures queue service levels (SLA) and target response times for customers waiting on the line.
Metric
Description
Queue SLA
The target service level percentage set for the queue typically defined as the percentage of calls that should be answered within the target answer time (e.g., 80% of calls answered within 20 seconds). This is a goal used for staffing and performance planning.
Shrinkage
The percentage of time agents are unavailable for call handling due to factors like breaks, training, meetings, or absenteeism. Shrinkage is used to adjust staffing requirements to reflect real-world availability.
Target answer (s)
The maximum acceptable time, in seconds, for an agent to answer a call once it enters the queue. This value is used in SLA calculations and to determine staffing needs using the Erlang C formula.
Expected agents needed for queue calls WITH shrinkage
The adjusted number of agents required to meet SLA targets, factoring in agent unavailability (shrinkage). This provides a more realistic staffing requirement for effective queue performance.
Expected agents needed for queue calls WITHOUT shrinkage
The estimated number of agents required to meet the SLA and call volume demand assuming full agent availability. This is a theoretical minimum before accounting for shrinkage.
Average Agents WITH shrinkage per queue
The average number of agents available per queue after accounting for shrinkage. This reflects the actual effective agent capacity to handle calls in each queue.
Social
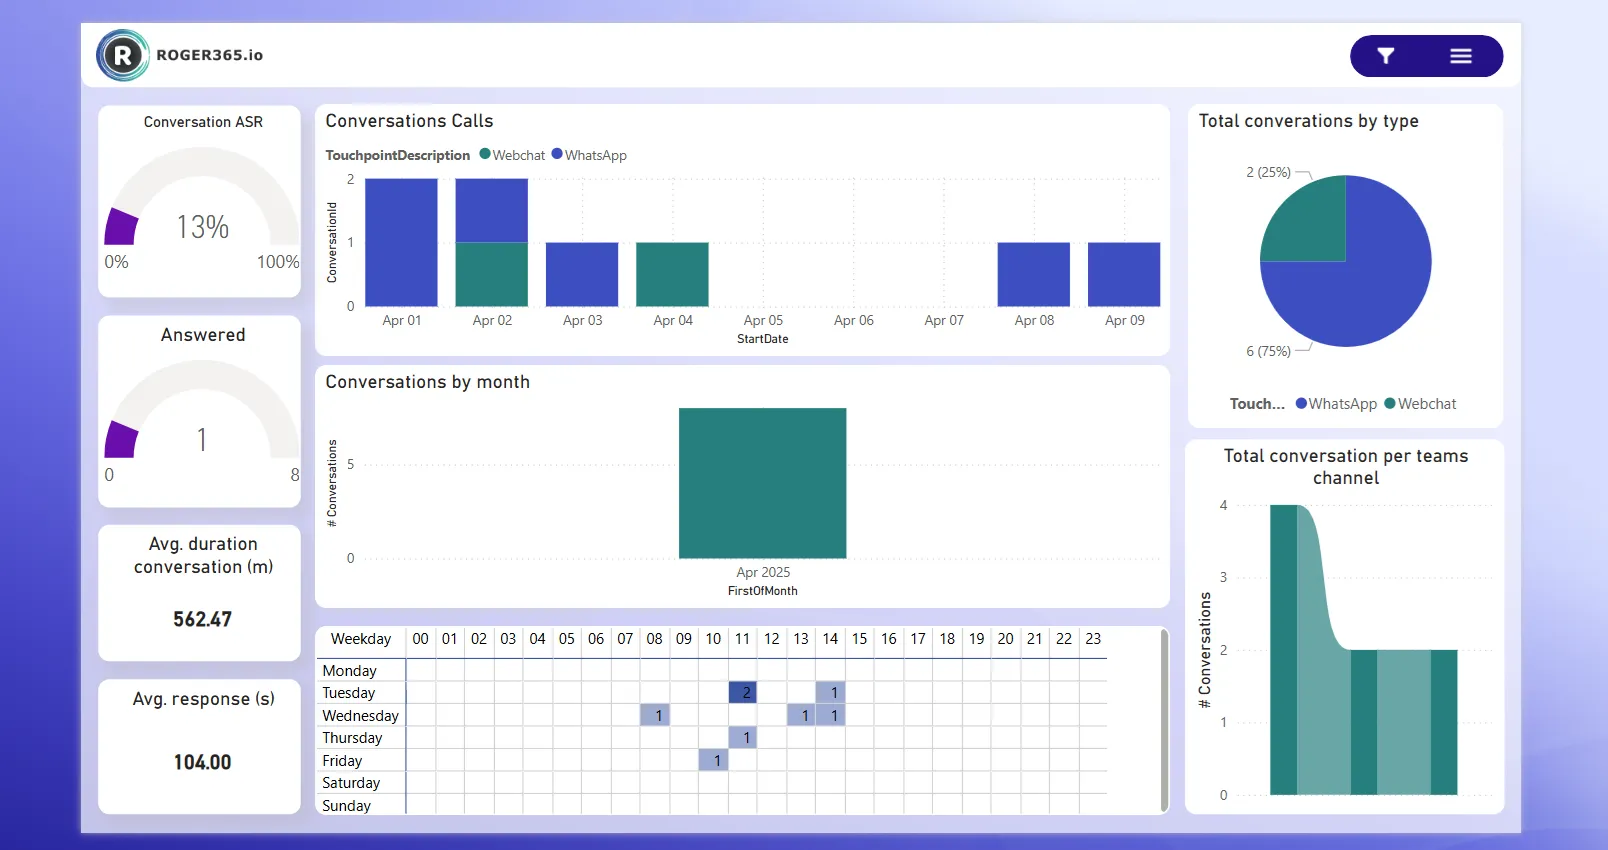
This page provides an overview of social interactions, displaying metrics such as total interactions per type, average interaction time, and statistics over a period of time.
Metric
Description
Conversation ASR
Percentage of conversations that were successfully connected to an agent, relative to the total number of attempted conversations. A higher ASR indicates that most conversations are being handled properly, reflecting a well-functioning Contact Center.
Answered
Amount of conversations that were successfully connected to an agent, relative to the total number of attempted conversations.
Average Interaction time (s)
The average amount of time in seconds that a external participant spend interaction with the agent.
Average Response time (s)
The average amount of time in seconds that a conversations has to wait before being assigned to an agent.
Conversation calls
The total number of conversations made by customers. This provides an overview of the volume of conversations from customers.
Conversations by month
Breakdown of total conversations received per month.
Heatmap
Conversation volumes across different times of day and days of the week. The color intensity shows when calls are highest (darker colors) and lowest (lighter colors).
Total Conversation by type
The total number of conversation by type
Total conversations per Teams channel
The total number of conversation by assigned Teams channel
Classification
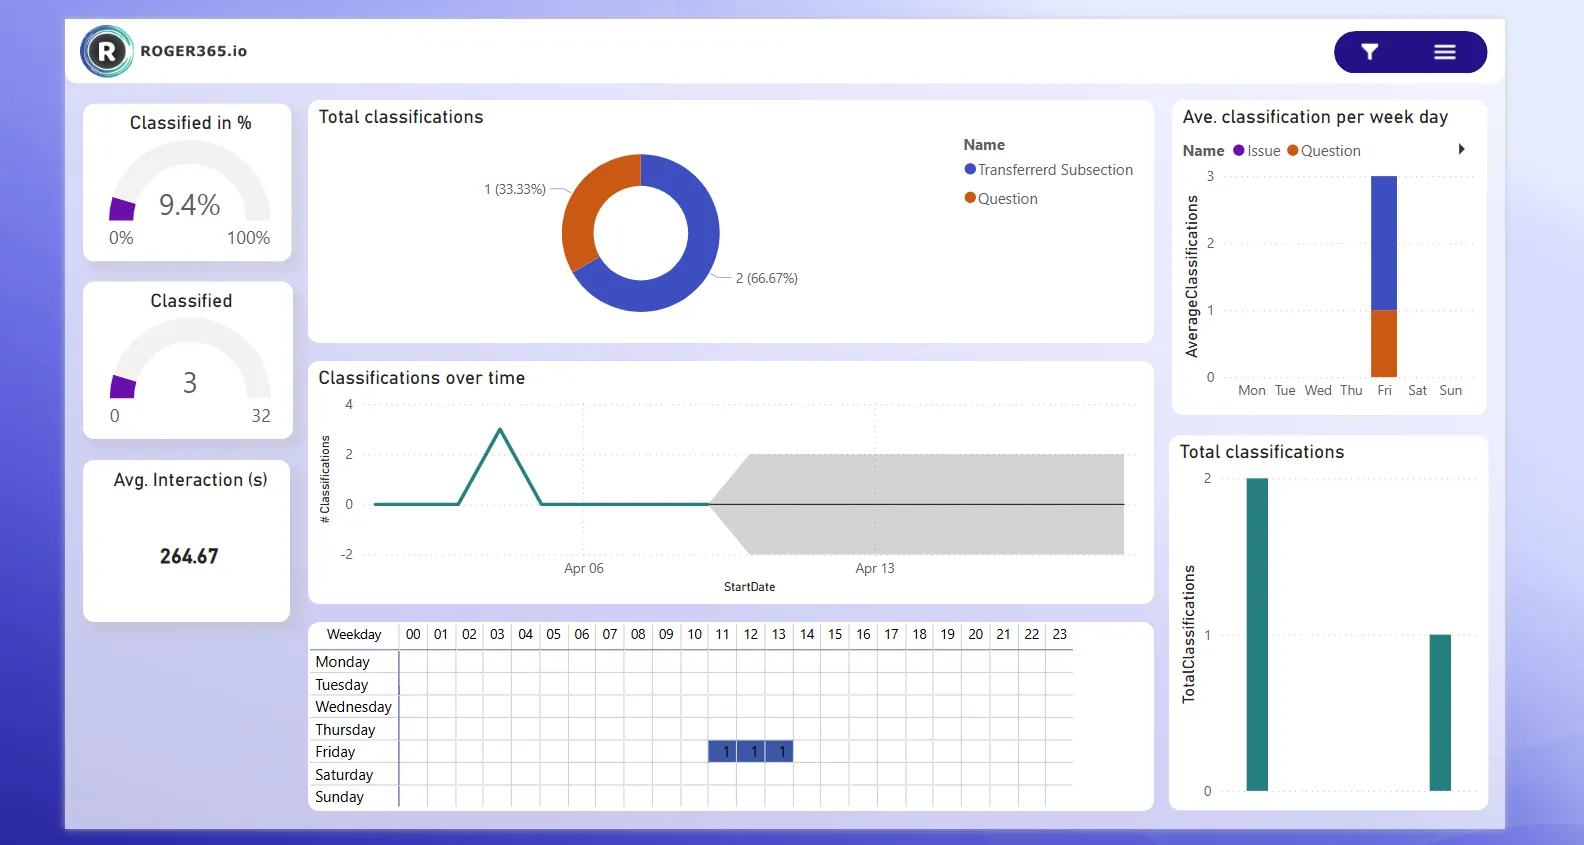
This page provides an overview of Classifications, displaying metrics such as total classified interactions, average interaction time of classified interactions, and statistics over a period of time.
Metric
Description
Classified in percentage
Percentage of classification that were successfully connected to an agent, relative to the total number of attempted conversations. A higher ASR indicates that most conversations are being classified properly, reflecting a well-functioning Contact Center.
Classified in amount
Amount of classified conversation by an agent, relative to the total number of attempted conversations.
Average Interaction time (s)
The average amount of time in seconds that a external participant spend interaction with the agent.
Total Classifications per label
The total number of classifications per classification label.
Classifications over time
The total number of classifications made by agents. This provides an overview of the volume of classification over time.
Heatmap
Classification volumes across different times of day and days of the week. The color intensity shows when calls are highest (darker colors) and lowest (lighter colors).
Average Classifications per weekday
The total number of classifications by weekday
Total Classifications
The total number of classifications
Call rankings Top 30
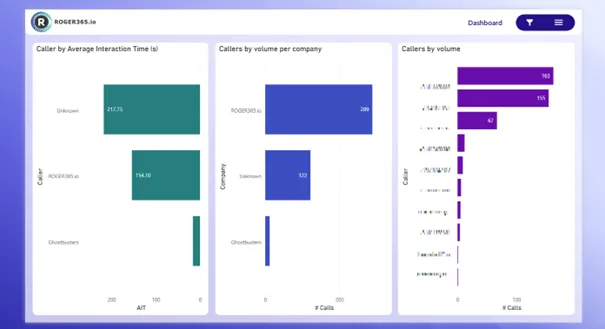
This page ranks the top 30 callers by volume, offering detailed insights into which numbers or companies are generating the most calls. This is useful for identifying trends in high-call volume sources and monitoring their impact.
Metric
Description
Caller by average interaction time (s)
Ranks callers based on the average length of their interactions. This can help identify trends in customer needs and the complexity of issues.
Caller by volume per company
This metric ranks callers by the number of calls made per company, providing insights into high-volume callers from specific organizations.
Caller by volume
Ranks callers by the total number of calls made. This helps in identifying the highest call generators, which may require special attention or resource allocation.
Agent rankings Top 30
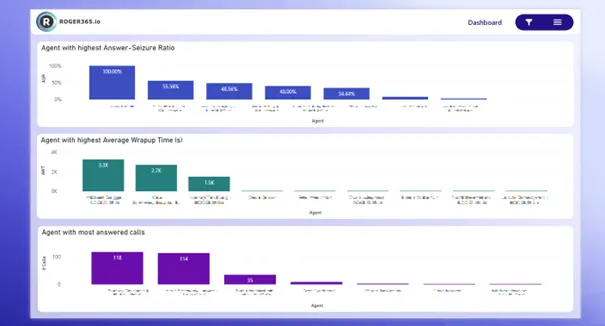
This page ranks agents by various performance metrics, such as answer-seizure ratio, average wrap-up time, and the number of answered calls. It helps in recognizing top-performing agents and provides visibility into individual contributions to the overall performance.
Metric
Description
Agent with highest Answer-Seizure ratio
Percentage of inbound calls that were successfully connected to an agent, relative to the total number of attempted inbound calls. A higher ASR indicates that most calls are being answered properly, reflecting a well-functioning Contact Center.
Agent with highest average wrap up time (s)
The agent with the highest average time spent wrapping up calls after interactions. This metric can help identify agents who may need additional support or training to reduce wrap-up time.
Agent with most answered calls
The agent who has answered the most calls. This metric helps recognize high-performing agents and assess workload distribution.
Queue rankings Top 30
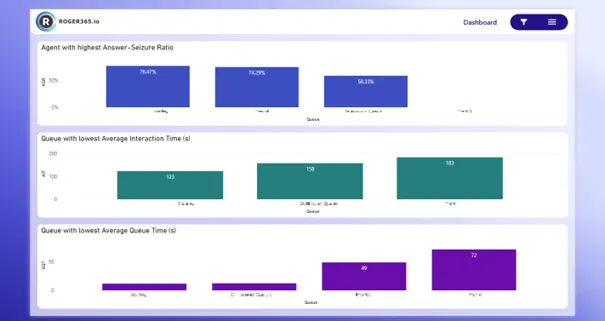
This page ranks queues based on their performance metrics like average interaction time and queue time. It provides insights into which queues are performing the best or worst, helping to optimize queue management and agent allocation.
Metric
Description
Queue with highest answer-seizure ratio
Percentage of Queue requests that were successfully connected to an agent, relative to the total number of attempted queue requests. A higher ASR indicates that most queue requests are being answered properly, reflecting a well-functioning Contact Center.
Queue with lowest average interaction time (s)
The queue with the shortest average interaction time, indicating that calls are handled quickly and efficiently.
Queue with lowest average queue time (s)
The queue with the shortest average wait time before a caller is connected to an agent, reflecting the speed at which calls are processed.
Definition list
Term
Description
KPI
Key Performance Indicator
ASR
Answer-seizure ratio. The ratio is calculated by dividing the number of successfully answered calls by the total number of calls attempted
Interaction time
Time after the call has been picked up by the first agent until the call is disconnected
Redirected
Calls which are redirected with the transfer or safe transfer action within a callflow
Ring time
Amount of time a call rings before being answered
Queue time
Amount of time a caller spends waiting in a queue before speaking to an agent
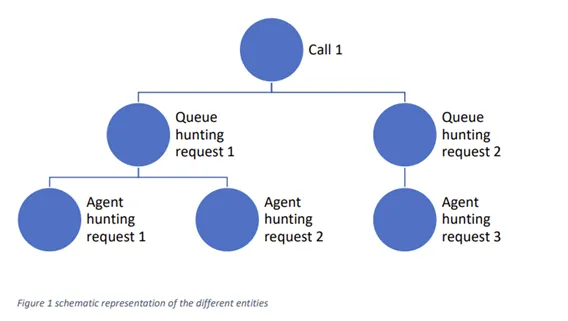
(Queue) Request
Each time a call enters a Queue it creates a Request.
Wrap up
Amount of time an agent has after the call is disconnected.