


Statistics

The Statistics screen gives an overview of call activity and agent availability for the queue, helping you understand how calls are being handled and how your team is distributed across different states. You can access it by clicking Statistics in the top navigation bar.
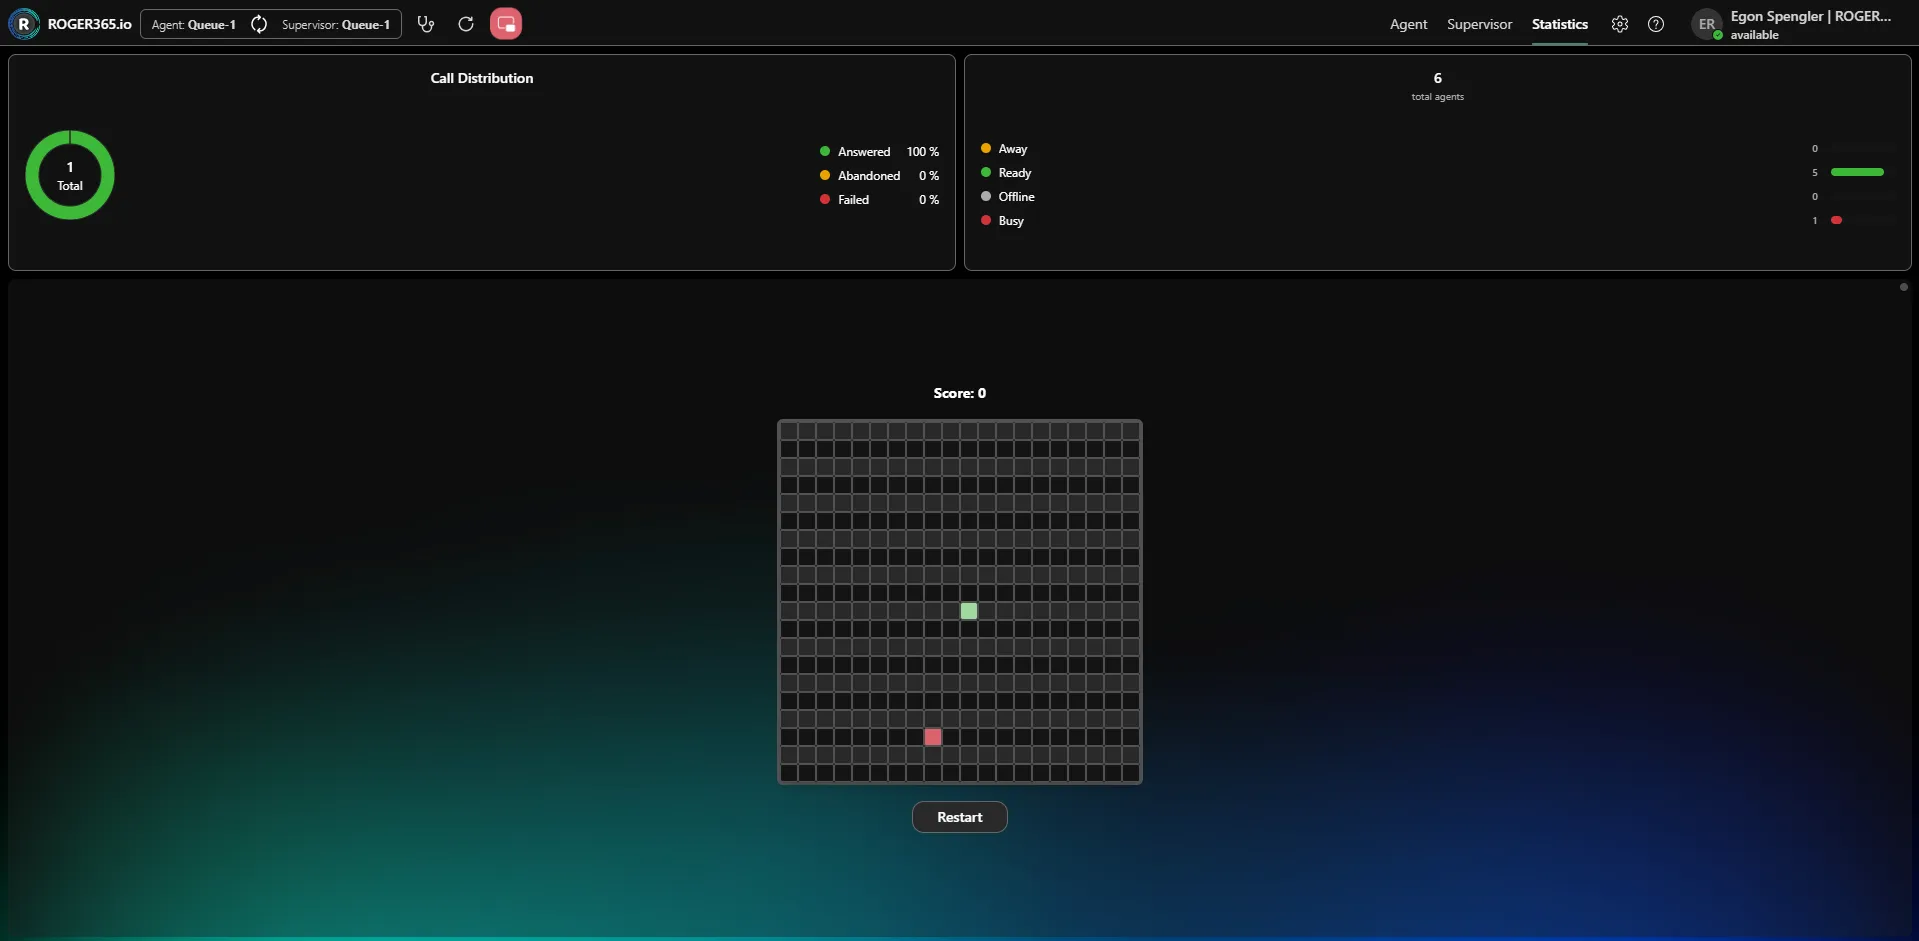
Call Distribution
This panel shows how calls have been handled, displayed as a donut chart with the total number of calls in the center (in this example, 1). The breakdown shows the percentage of calls in each category:
- Answered – Calls that were answered by an agent.
- Abandoned – Calls where the caller hung up before being answered.
- Failed – Calls that did not connect successfully.
Agent States
This panel shows the total number of agents (in this example, 6) and how they are currently distributed across the available states, with a count for each:
- Away – Agents who are temporarily away.
- Ready – Agents who are available to take calls.
- Offline – Agents who are not signed in.
- Busy – Agents who are currently on a call or otherwise occupied.
This gives you an at-a-glance view of how many agents are available and how many are occupied.